deep Views in Eclipse
The deep Eclipse plugin contains a set of various views which display the state of the processor or serve as logging output. These views are independent of the deep Debug Plugin.
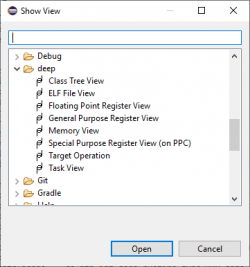
Open Views
ClassTreeView
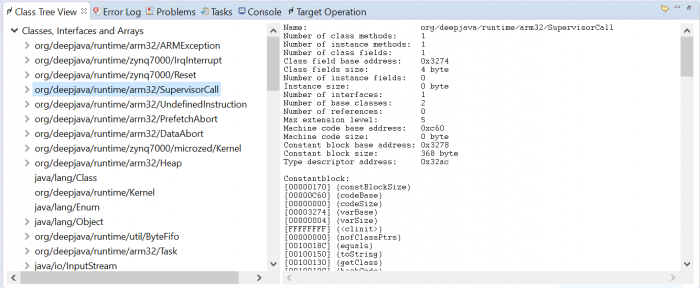
The ClassTreeView shows all classes and their methods which are loaded onto the target. Further, it shows how much target memory is used and which kind of memory is involved.
 By unfolding a class you get infomation for each method such as SSA (single static assignment or machine code.
Pay attention to the fact that the view doesn't refresh automatically. After recompiling a project and subsequent reloading of the target you have to refresh the view using the arrow button on the top right corner.
deep Register Views
There are register views for general purpose and floating point registers as well views for special purpose registers depending on the available processor.
Using the context menu of an entry you can change the display property of the value.

Buttons in the toolbar of the view allow the following actions:
- arrow → new reading of the value (refresh)
- red square → stop target
- green plus → start target
Memory View
This view displays memory blocks. You can choose the start address, the element size and the number of elements to read.

Press the button read to read or refresh the content of the window.
TargetOperation
This view allows for communication to and manupulation of the target. Several actions can be choosen in the drop down menu:
- Register: Reading and writing of registers. The register name must be inserted.
- Variablen: Reading and writing of static variables (class variables). Variable names have to be inserted by their fully qualified names. Package, class and variable name must be separated by full stops.
- Address: Reading and writing of absolute memory addresses.
- TargetCMD: Any static method of a class without parameters can be invoked by the host. Method names have to be inserted by their fully qualified names. Package, class and method name must be separates by full stops.
Any action can be repeated by clicking onto the green arrow. The down arrow sends to the target, the up arrow reads from the target. A message will be displayed in the last column if an error occurs during the action.


